Dashboards
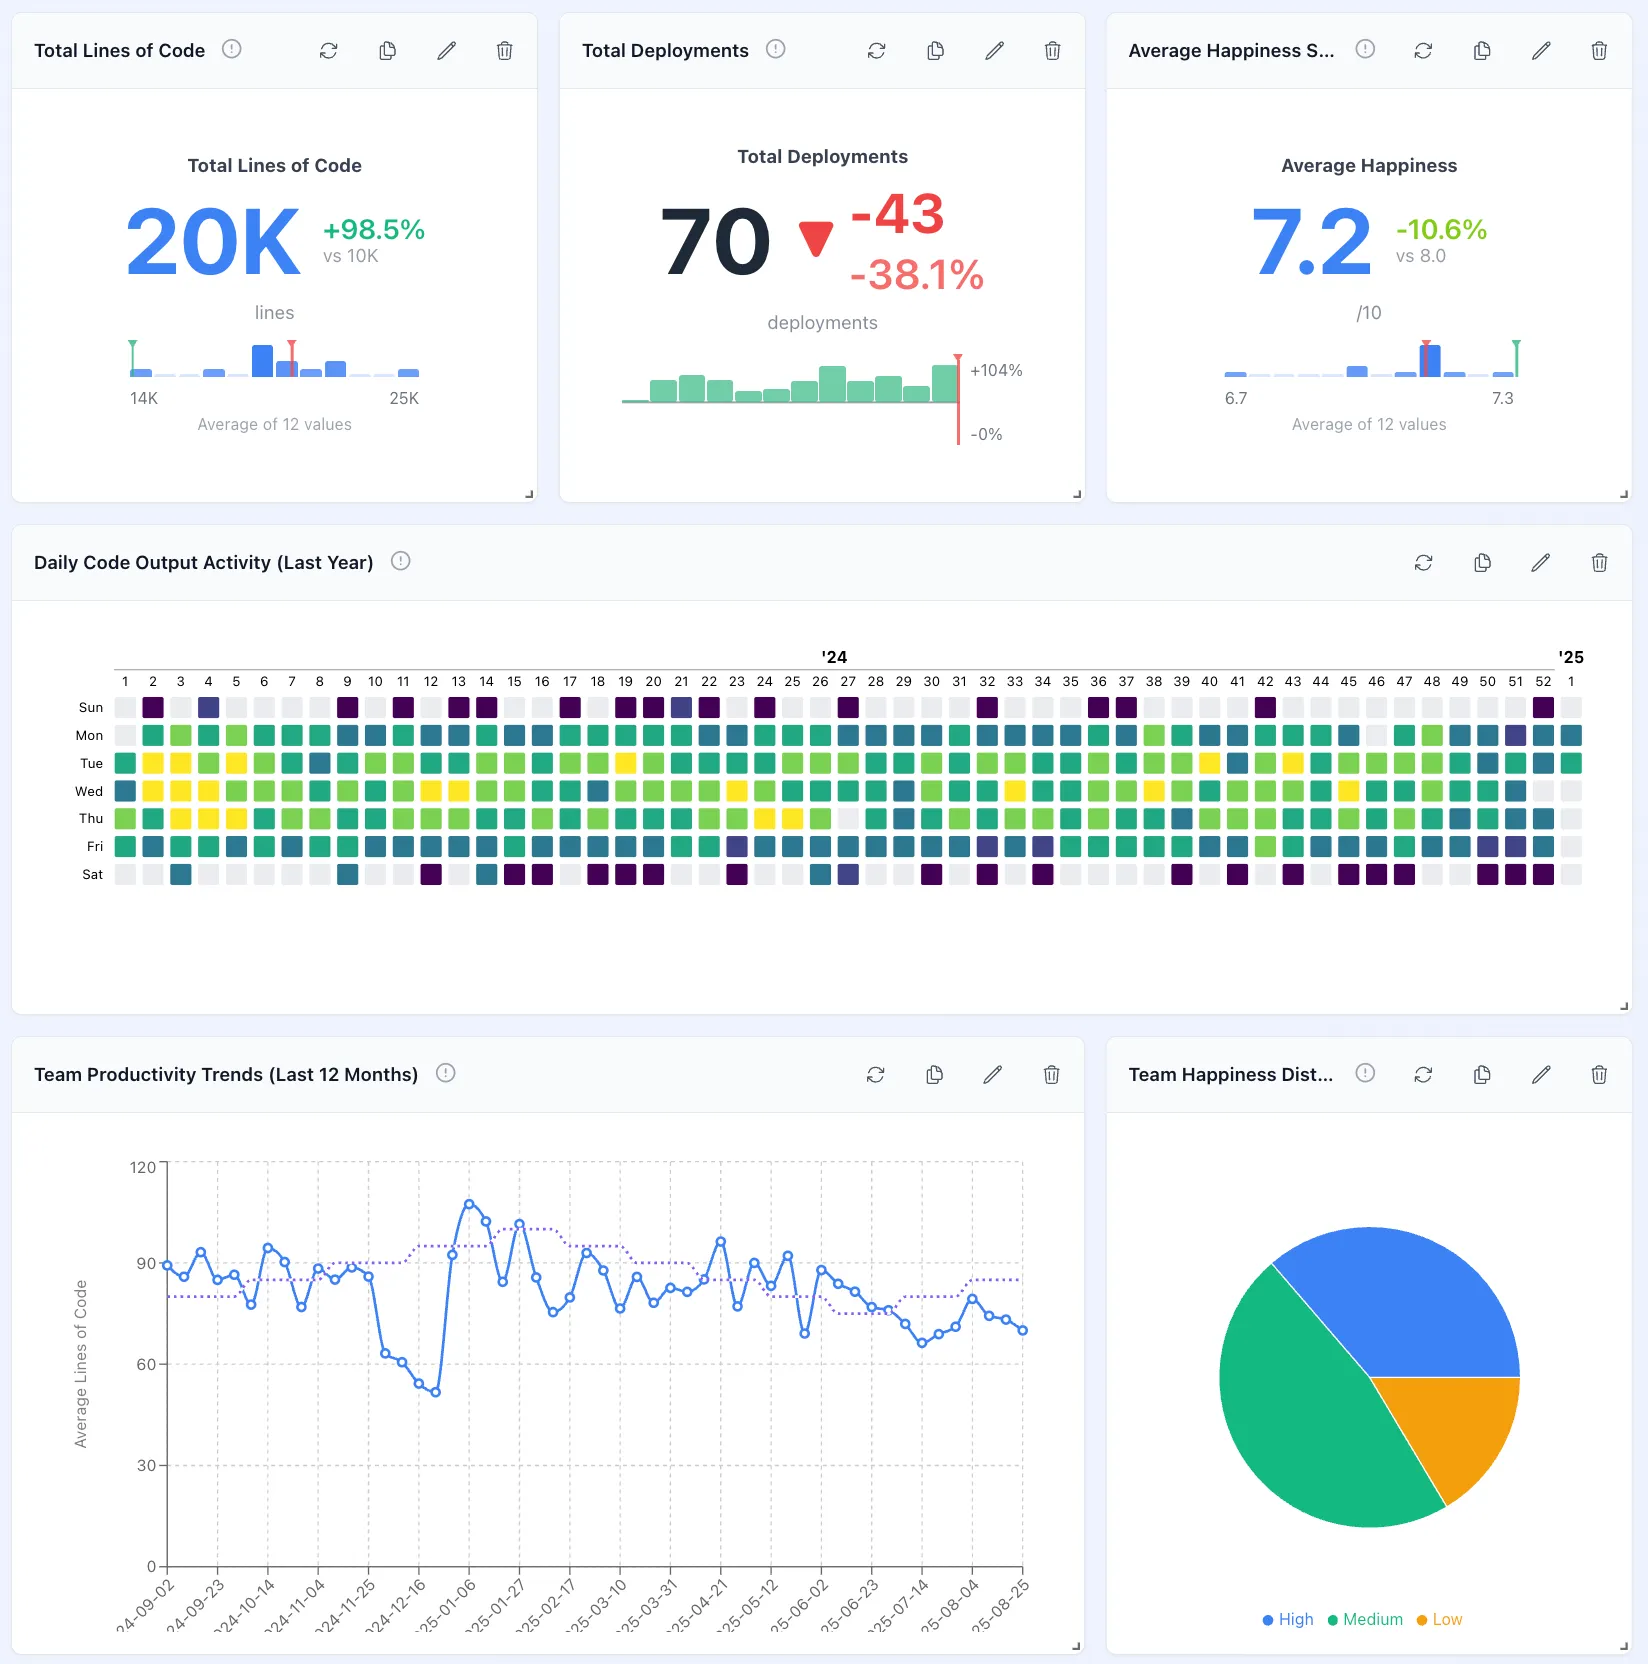
Embed production-ready analytics dashboards into your application with minimal code. Built on React and react-grid-layout, Drizzle Cube dashboards integrate directly with your semantic layer—giving your users the power to create, customize, and save their own dashboard layouts without backend changes.
- Charts — Bar, line, area, pie, and more
- Persistence — Save & load with your backend
- Analysis Builder — Query building UI
- Theming — Customize appearance
- Security — Multi-tenant isolation
- Quick Start — Get started fast
Why Drizzle Cube Dashboards?
Section titled “Why Drizzle Cube Dashboards?”- Type-safe configuration — Full TypeScript support with
DashboardConfigandPortletConfiginterfaces - Semantic layer integration — Queries use your cube definitions, ensuring consistent business logic
- Drag-and-drop layouts — Users can rearrange, resize, and customize their view
- Flexible layout modes — Grid-based or row-based layouts to match your UX patterns
- Built-in persistence — Save and restore dashboard configurations with your own backend
- Multi-tenant ready — Security context flows through from your semantic layer
- Modular imports — Import only what you need (~218KB for dashboard-only builds)
Installation
Section titled “Installation”# Full client (includes dashboards)npm install drizzle-cube react react-dom recharts react-grid-layout
# Components only (dashboards without charts - ~218KB)npm install drizzle-cube react react-dom react-grid-layout
# With charts (modular approach)npm install drizzle-cube react react-dom recharts react-grid-layoutImport Options
Section titled “Import Options”// Full client importimport { AnalyticsDashboard, DashboardGrid, AnalyticsPortlet } from 'drizzle-cube/client';
// Components-only import (dashboard without built-in charts)import { AnalyticsDashboard, DashboardGrid, AnalyticsPortlet, Modal, DashboardEditModal} from 'drizzle-cube/client/components';import { AnalysisBuilder, PortletAnalysisModal } from 'drizzle-cube/client';
// Combined modular approachimport { AnalyticsDashboard, DashboardGrid } from 'drizzle-cube/client/components';import { RechartsBarChart, RechartsLineChart } from 'drizzle-cube/client/charts';import { useCubeQuery } from 'drizzle-cube/client/hooks';import { CubeProvider } from 'drizzle-cube/client/providers';Overview
Section titled “Overview”The dashboard system consists of three main components: DashboardGrid for layout management, AnalyticsPortlet for individual visualizations, and various configuration interfaces for customization. All components are designed to work seamlessly with Cube.js-compatible data and the useCubeQuery hook.
Bundle Size Considerations
Section titled “Bundle Size Considerations”- Full client: Complete dashboard functionality with all chart types
- Components-only: Dashboard UI without built-in charts (~218KB) - bring your own charts
- Modular approach: Mix and match components, charts, hooks as needed for optimal bundle size
Core Components
Section titled “Core Components”DashboardGrid
Section titled “DashboardGrid”The main dashboard container that manages layout, editing, and portlet interactions.
import { DashboardGrid } from 'drizzle-cube/client'
function MyDashboard() {  const [config, setConfig] = useState<DashboardConfig>({    id: 'main-dashboard',    name: 'Analytics Dashboard',    portlets: [      {        id: 'employees-chart',        name: 'Employee Count',        x: 0, y: 0, w: 6, h: 4,        chartConfig: {          xAxis: ['Employees.createdAt'],          yAxis: ['Employees.count']        },        query: {          measures: ['Employees.count'],          timeDimensions: [{            dimension: 'Employees.createdAt',            granularity: 'month'          }]        },        chartType: 'bar'      }    ]  })
  return (    <DashboardGrid      config={config}      editable={true}      onConfigChange={setConfig}      onSave={saveDashboardConfig}      dashboardModes={['rows', 'grid']}  // Available layout modes    />  )}
AnalyticsPortlet
Section titled “AnalyticsPortlet”Individual visualization components within the dashboard.
import { AnalyticsPortlet } from 'drizzle-cube/client'
<AnalyticsPortlet  config={{    id: 'revenue-chart',    name: 'Monthly Revenue',    query: {      measures: ['Orders.totalRevenue'],      timeDimensions: [{        dimension: 'Orders.createdAt',        granularity: 'month',        dateRange: ['2023-01-01', '2023-12-31']      }]    },    chartConfig: {      xAxis: ['Orders.createdAt'],      yAxis: ['Orders.totalRevenue']    },    chartType: 'line'  }}  apiUrl="/cubejs-api/v1"  onEdit={() => setEditingPortlet(config)}  onRefresh={() => refreshPortlet(config.id)}  onDelete={() => deletePortlet(config.id)}/>
Configuration Structure
Section titled “Configuration Structure”Dashboard Configuration
Section titled “Dashboard Configuration”interface DashboardConfig { id: string name: string description?: string portlets: PortletConfig[] layoutMode?: 'grid' | 'rows' // Layout mode (default: 'grid') grid?: { cols: number // Grid columns (default: 12) rowHeight: number // Row height in pixels (default: 80) minW: number // Minimum portlet width (default: 2) minH: number // Minimum portlet height (default: 2) } rows?: RowLayout[] // Row definitions for 'rows' mode layouts?: { [breakpoint: string]: LayoutItem[] } // react-grid-layout layouts colorPalette?: string // Color palette name (default: 'default') filters?: DashboardFilter[] // Dashboard-level filters eagerLoad?: boolean // Force immediate loading (default: false)}Portlet Configuration
Section titled “Portlet Configuration”interface PortletConfig { id: string name: string description?: string
// Layout (react-grid-layout format) x: number // X position in grid y: number // Y position in grid w: number // Width in grid units h: number // Height in grid units minW?: number // Minimum width minH?: number // Minimum height
/** * NEW (v0.3.0+): Canonical format for analysis configuration. * When present, this is the source of truth for query/chart config. * See /api-reference/analysis-config for complete documentation. */ analysisConfig?: AnalysisConfig
// Legacy fields (kept for backward compatibility) query: CubeQuery | string // Cube.js query object or JSON string chartType: ChartType // Chart visualization type chartConfig?: ChartAxisConfig // Axis mapping configuration displayConfig?: ChartDisplayConfig // Chart display options
// Dashboard filter integration dashboardFilterMapping?: string[] // IDs of dashboard filters to apply
// Behavior autoRefresh?: number // Auto-refresh interval (seconds) cachingEnabled?: boolean // Enable result caching}AnalysisConfig Integration
Section titled “AnalysisConfig Integration”As of v0.3.0, portlets can use the new AnalysisConfig format for configuration:
// New format with AnalysisConfigconst portlet: PortletConfig = {  id: 'revenue-chart',  name: 'Monthly Revenue',  x: 0, y: 0, w: 6, h: 4,
  // New canonical format  analysisConfig: {    version: 1,    analysisType: 'query',    activeView: 'chart',    charts: {      query: {        chartType: 'line',        chartConfig: { xAxis: ['Orders.date'], yAxis: ['Orders.revenue'] },        displayConfig: { showLegend: true }      }    },    query: {      measures: ['Orders.revenue'],      timeDimensions: [{ dimension: 'Orders.date', granularity: 'month' }]    }  }}
Migration: Legacy portlets without analysisConfig are automatically migrated at runtime. See Config Migration Guide for details.
Dashboard Features
Section titled “Dashboard Features”Drag-and-Drop Layout
Section titled “Drag-and-Drop Layout”Enable interactive layout editing:
<DashboardGrid config={config} editable={true} // Enable editing mode onConfigChange={(newConfig) => { setConfig(newConfig) // Optionally auto-save changes saveDashboardConfig(newConfig) }}/>Features:
- Drag portlets to reposition
- Resize portlets by dragging corners
- Responsive breakpoints for different screen sizes
- Snap-to-grid alignment
Layout Modes
Section titled “Layout Modes”Dashboards support two layout modes that control how portlets are arranged and edited:
// Control available layout modes<DashboardGrid  config={config}  editable={true}  dashboardModes={['grid', 'rows']}  // Allow both modes (default)/>
// Restrict to rows-only mode<DashboardGrid  config={config}  editable={true}  dashboardModes={['rows']}/>
// Restrict to grid-only mode<DashboardGrid  config={config}  editable={true}  dashboardModes={['grid']}/>
Grid Mode
Section titled “Grid Mode”The default free-form layout mode using react-grid-layout:
- Free positioning: Drag portlets anywhere on the grid
- Flexible sizing: Resize portlets in any direction (all 8 handles)
- Automatic compaction: Portlets compact vertically to fill gaps
- Pixel-perfect control: Position portlets at any grid coordinate
Best for: Complex dashboards requiring precise layout control.
Rows Mode
Section titled “Rows Mode”A structured row-based layout mode:
- Row organization: Portlets are organized into horizontal rows
- Equal distribution: Portlets within a row are automatically sized equally
- Simplified editing: Drag portlets between rows or create new rows
- Consistent heights: All portlets in a row share the same height
- Column resizing: Drag between columns to adjust relative widths
Best for: Clean, organized dashboards with consistent structure.
Mode Switching
Section titled “Mode Switching”When both modes are enabled, users can switch between them in edit mode:
// The mode switcher appears in the dashboard toolbar when:// 1. editable={true}// 2. dashboardModes includes both 'grid' and 'rows'// 3. User is in edit mode
<DashboardGrid  config={config}  editable={true}  dashboardModes={['rows', 'grid']}  // Shows Grid/Rows toggle in edit mode  onConfigChange={(newConfig) => {    // newConfig.layoutMode will be 'grid' or 'rows'    setConfig(newConfig)  }}/>
Configuration by Mode
Section titled “Configuration by Mode”The dashboard configuration stores mode-specific layout data:
interface DashboardConfig {  portlets: PortletConfig[]  layoutMode?: 'grid' | 'rows'  // Current active mode
  // Grid mode uses x, y, w, h on each portlet  // plus optional react-grid-layout layouts object  layouts?: { [breakpoint: string]: LayoutItem[] }
  // Rows mode uses structured row definitions  rows?: RowLayout[]
  // Grid settings apply to both modes  grid?: {    cols: number      // Grid columns (default: 12)    rowHeight: number // Row height in pixels (default: 80)    minW: number      // Minimum portlet width (default: 2)    minH: number      // Minimum portlet height (default: 2)  }}
interface RowLayout {  id: string  h: number  // Row height in grid units  columns: {    portletId: string    w: number  // Column width in grid units  }[]}
Responsive Design
Section titled “Responsive Design”Dashboards automatically adapt to different screen sizes:
// Default responsive configurationlayout: { breakpoints: { lg: 1200, md: 996, sm: 768, xs: 480, xxs: 0 }, cols: { lg: 12, md: 10, sm: 6, xs: 4, xxs: 2 }, margin: [16, 16], containerPadding: [16, 16]}Real-time Updates
Section titled “Real-time Updates”Portlets support automatic refresh and real-time updates:
// Portlet with auto-refresh every 30 seconds{ id: 'live-metrics', name: 'Live Metrics', query: { /* ... */ }, chartConfig: { /* ... */ }, chartType: 'line', autoRefresh: 30 // Refresh every 30 seconds}Portlet Types
Section titled “Portlet Types”Chart Portlets
Section titled “Chart Portlets”Display various chart types with full interactivity:
// Bar Chart Portlet{  chartType: 'bar',  chartConfig: {    xAxis: ['Employees.departmentName'],    yAxis: ['Employees.count', 'Employees.avgSalary']  },  displayConfig: {    showLegend: true,    stackedBarChart: false  }}
// Time Series Line Chart{  chartType: 'line',  chartConfig: {    xAxis: ['Orders.createdAt'],    yAxis: ['Orders.totalRevenue']  },  query: {    measures: ['Orders.totalRevenue'],    timeDimensions: [{      dimension: 'Orders.createdAt',      granularity: 'day'    }]  }}
Table Portlets
Section titled “Table Portlets”Display data in tabular format:
{ chartType: 'table', query: { measures: ['Employees.count', 'Employees.avgSalary'], dimensions: ['Employees.departmentName'], order: [['Employees.count', 'desc']] }, displayConfig: { showPagination: true, pageSize: 10, sortable: true }}KPI/Metric Portlets
Section titled “KPI/Metric Portlets”Display single metrics or key performance indicators:
{ chartType: 'kpi', query: { measures: ['Orders.totalRevenue'] }, displayConfig: { format: 'currency', showChange: true, compareToLastPeriod: true }}Interactive Features
Section titled “Interactive Features”Portlet Editing Modal
Section titled “Portlet Editing Modal”Built-in modal for configuring portlets (uses the modern Analysis Builder):
import { PortletAnalysisModal } from 'drizzle-cube/client'
function DashboardEditor() {  const [editingPortlet, setEditingPortlet] = useState<PortletConfig | null>(null)
  return (    <>      <DashboardGrid        config={config}        editable={true}        onPortletEdit={setEditingPortlet}      />
      {editingPortlet && (        <PortletAnalysisModal          portlet={editingPortlet}          isOpen={!!editingPortlet}          title="Edit portlet"          submitText="Save"          onClose={() => setEditingPortlet(null)}          onSave={(updatedPortlet) => {            updatePortletConfig(updatedPortlet)            setEditingPortlet(null)          }}        />      )}    </>  )}
Portlet Actions
Section titled “Portlet Actions”Standard portlet actions for management:
// Portlet header actionsconst portletActions = [ { icon: 'refresh', label: 'Refresh', onClick: () => refreshPortlet(portletId) }, { icon: 'edit', label: 'Edit', onClick: () => setEditingPortlet(portlet) }, { icon: 'delete', label: 'Delete', onClick: () => deletePortlet(portletId) }]Advanced Configuration
Section titled “Advanced Configuration”Custom Breakpoints
Section titled “Custom Breakpoints”Define custom responsive breakpoints:
const customLayout = { breakpoints: { xl: 1400, // Extra large screens lg: 1200, // Large screens md: 996, // Medium screens sm: 768, // Small screens (tablets) xs: 480 // Extra small screens (phones) }, cols: { xl: 16, // 16 columns on XL screens lg: 12, // 12 columns on large screens md: 8, // 8 columns on medium screens sm: 4, // 4 columns on small screens xs: 2 // 2 columns on mobile }}Dashboard Themes
Section titled “Dashboard Themes”Apply custom styling and themes:
<div className="dashboard-theme-dark">  <DashboardGrid    config={config}    editable={false}  /></div>
<style>.dashboard-theme-dark .portlet {  @apply bg-gray-800 text-white border-gray-700;}
.dashboard-theme-dark .portlet-header {  @apply bg-gray-700 border-gray-600;}</style>
Custom Loading Indicator
Section titled “Custom Loading Indicator”Customize the loading spinner shown while portlets are fetching data. By default, a theme-aware spinner is displayed using var(--dc-primary) for the color.
Dashboard-level override - applies to all portlets:
import { AnalyticsDashboard } from 'drizzle-cube/client'
// Custom loading componentconst MyCustomLoader = () => (  <div className="flex items-center justify-center">    <img      src="/my-logo.png"      alt="Loading..."      className="h-10 w-10 animate-spin"    />  </div>)
// Apply to all portlets in the dashboard<AnalyticsDashboard  config={config}  editable={true}  loadingComponent={<MyCustomLoader />}/>
Portlet-level override - when using AnalyticsPortlet directly:
import { AnalyticsPortlet } from 'drizzle-cube/client'
<AnalyticsPortlet  query={query}  chartType="bar"  chartConfig={chartConfig}  loadingComponent={<MyCustomLoader />}/>
Using the built-in LoadingIndicator with different sizes:
import { LoadingIndicator } from 'drizzle-cube/client'
// Available sizes: 'sm' (24px), 'md' (32px), 'lg' (48px)<LoadingIndicator size="lg" /><LoadingIndicator size="md" />  // default<LoadingIndicator size="sm" />
The default LoadingIndicator component uses var(--dc-primary) for its color, so it automatically adapts to your theme settings.
Dashboard Persistence
Section titled “Dashboard Persistence”Save and load dashboard configurations:
// Save dashboard configurationconst saveDashboardConfig = async (config: DashboardConfig) => {  await fetch('/api/dashboards', {    method: 'POST',    headers: { 'Content-Type': 'application/json' },    body: JSON.stringify(config)  })}
// Load dashboard configurationconst loadDashboardConfig = async (dashboardId: string) => {  const response = await fetch(`/api/dashboards/${dashboardId}`)  return response.json() as DashboardConfig}
Performance Optimization
Section titled “Performance Optimization”Lazy Loading
Section titled “Lazy Loading”Load portlets on demand for better performance:
import { lazy, Suspense } from 'react'
const LazyAnalyticsPortlet = lazy(() => import('drizzle-cube/client').then(m => ({  default: m.AnalyticsPortlet})))
function OptimizedDashboard({ config }: { config: DashboardConfig }) {  return (    <DashboardGrid config={config}>      {config.portlets.map(portlet => (        <Suspense key={portlet.id} fallback={<PortletSkeleton />}>          <LazyAnalyticsPortlet config={portlet} />        </Suspense>      ))}    </DashboardGrid>  )}
Query Caching
Section titled “Query Caching”Enable caching for improved performance:
// Portlet with caching enabled{ id: 'cached-chart', query: { /* ... */ }, cachingEnabled: true, // Enable result set caching cacheTimeout: 300 // Cache for 5 minutes}Virtual Scrolling
Section titled “Virtual Scrolling”For dashboards with many portlets:
// Enable virtualization for large dashboards<DashboardGrid config={config} virtualScrolling={true} visiblePortletBuffer={5} // Render 5 portlets outside viewport/>Testing Dashboards
Section titled “Testing Dashboards”import { render, screen, fireEvent } from '@testing-library/react'import { DashboardGrid } from 'drizzle-cube/client'
const mockConfig: DashboardConfig = { id: 'test-dashboard', name: 'Test Dashboard', portlets: [{ id: 'test-portlet', name: 'Test Chart', x: 0, y: 0, w: 6, h: 4, query: { measures: ['Test.count'] }, chartType: 'bar', chartConfig: { yAxis: ['Test.count'] } }]}
test('renders dashboard with portlets', () => { render(<DashboardGrid config={mockConfig} />)
expect(screen.getByText('Test Chart')).toBeInTheDocument()})
test('handles portlet editing', () => { const onConfigChange = jest.fn()
render( <DashboardGrid config={mockConfig} editable={true} onConfigChange={onConfigChange} /> )
// Test editing interactions const editButton = screen.getByRole('button', { name: /edit/i }) fireEvent.click(editButton)
// Verify edit modal opens expect(screen.getByRole('dialog')).toBeInTheDocument()})Best Practices
Section titled “Best Practices”- Responsive Design: Always test dashboards on different screen sizes
- Performance: Limit the number of portlets per dashboard (< 20)
- User Experience: Provide loading states and error handling
- Data Freshness: Set appropriate auto-refresh intervals
- Security: Ensure all queries respect security context
- Accessibility: Use proper ARIA labels and keyboard navigation
- Persistence: Save dashboard state frequently to prevent data loss
Dashboard Examples
Section titled “Dashboard Examples”Executive Dashboard
Section titled “Executive Dashboard”const executiveDashboard: DashboardConfig = { id: 'executive-dashboard', name: 'Executive Overview', portlets: [ // Revenue KPI { id: 'total-revenue', name: 'Total Revenue', x: 0, y: 0, w: 3, h: 2, chartType: 'kpi', query: { measures: ['Orders.totalRevenue'] } }, // Growth Chart { id: 'revenue-growth', name: 'Revenue Growth', x: 3, y: 0, w: 9, h: 4, chartType: 'line', query: { measures: ['Orders.totalRevenue'], timeDimensions: [{ dimension: 'Orders.createdAt', granularity: 'month', dateRange: ['2023-01-01', '2024-12-31'] }] } } ]}Operations Dashboard
Section titled “Operations Dashboard”const operationsDashboard: DashboardConfig = { id: 'operations-dashboard', name: 'Operations Metrics', portlets: [ // Employee Productivity { id: 'productivity-trend', name: 'Productivity Trend', x: 0, y: 0, w: 8, h: 4, chartType: 'area', query: { measures: ['Productivity.avgLinesOfCode'], dimensions: ['Productivity.departmentName'], timeDimensions: [{ dimension: 'Productivity.date', granularity: 'week' }] } }, // Department Comparison { id: 'dept-comparison', name: 'Department Comparison', x: 8, y: 0, w: 4, h: 4, chartType: 'bar', query: { measures: ['Employees.count', 'Employees.avgSalary'], dimensions: ['Employees.departmentName'] } } ]}Next Steps
Section titled “Next Steps”- Implement Dashboard Persistence for saving and loading dashboards
- Learn about Hooks for data fetching patterns
- Explore Charts for visualization options
- Review React Client overview
- Check dashboard examples in the repository
Roadmap Ideas
Section titled “Roadmap Ideas”- Dashboard templates and marketplace
- Advanced dashboard sharing and collaboration
- Dashboard embedding and white-labeling
- Real-time dashboard notifications and alerts
- Dashboard performance analytics
- Advanced dashboard filtering and drill-down capabilities