
React Client Overview
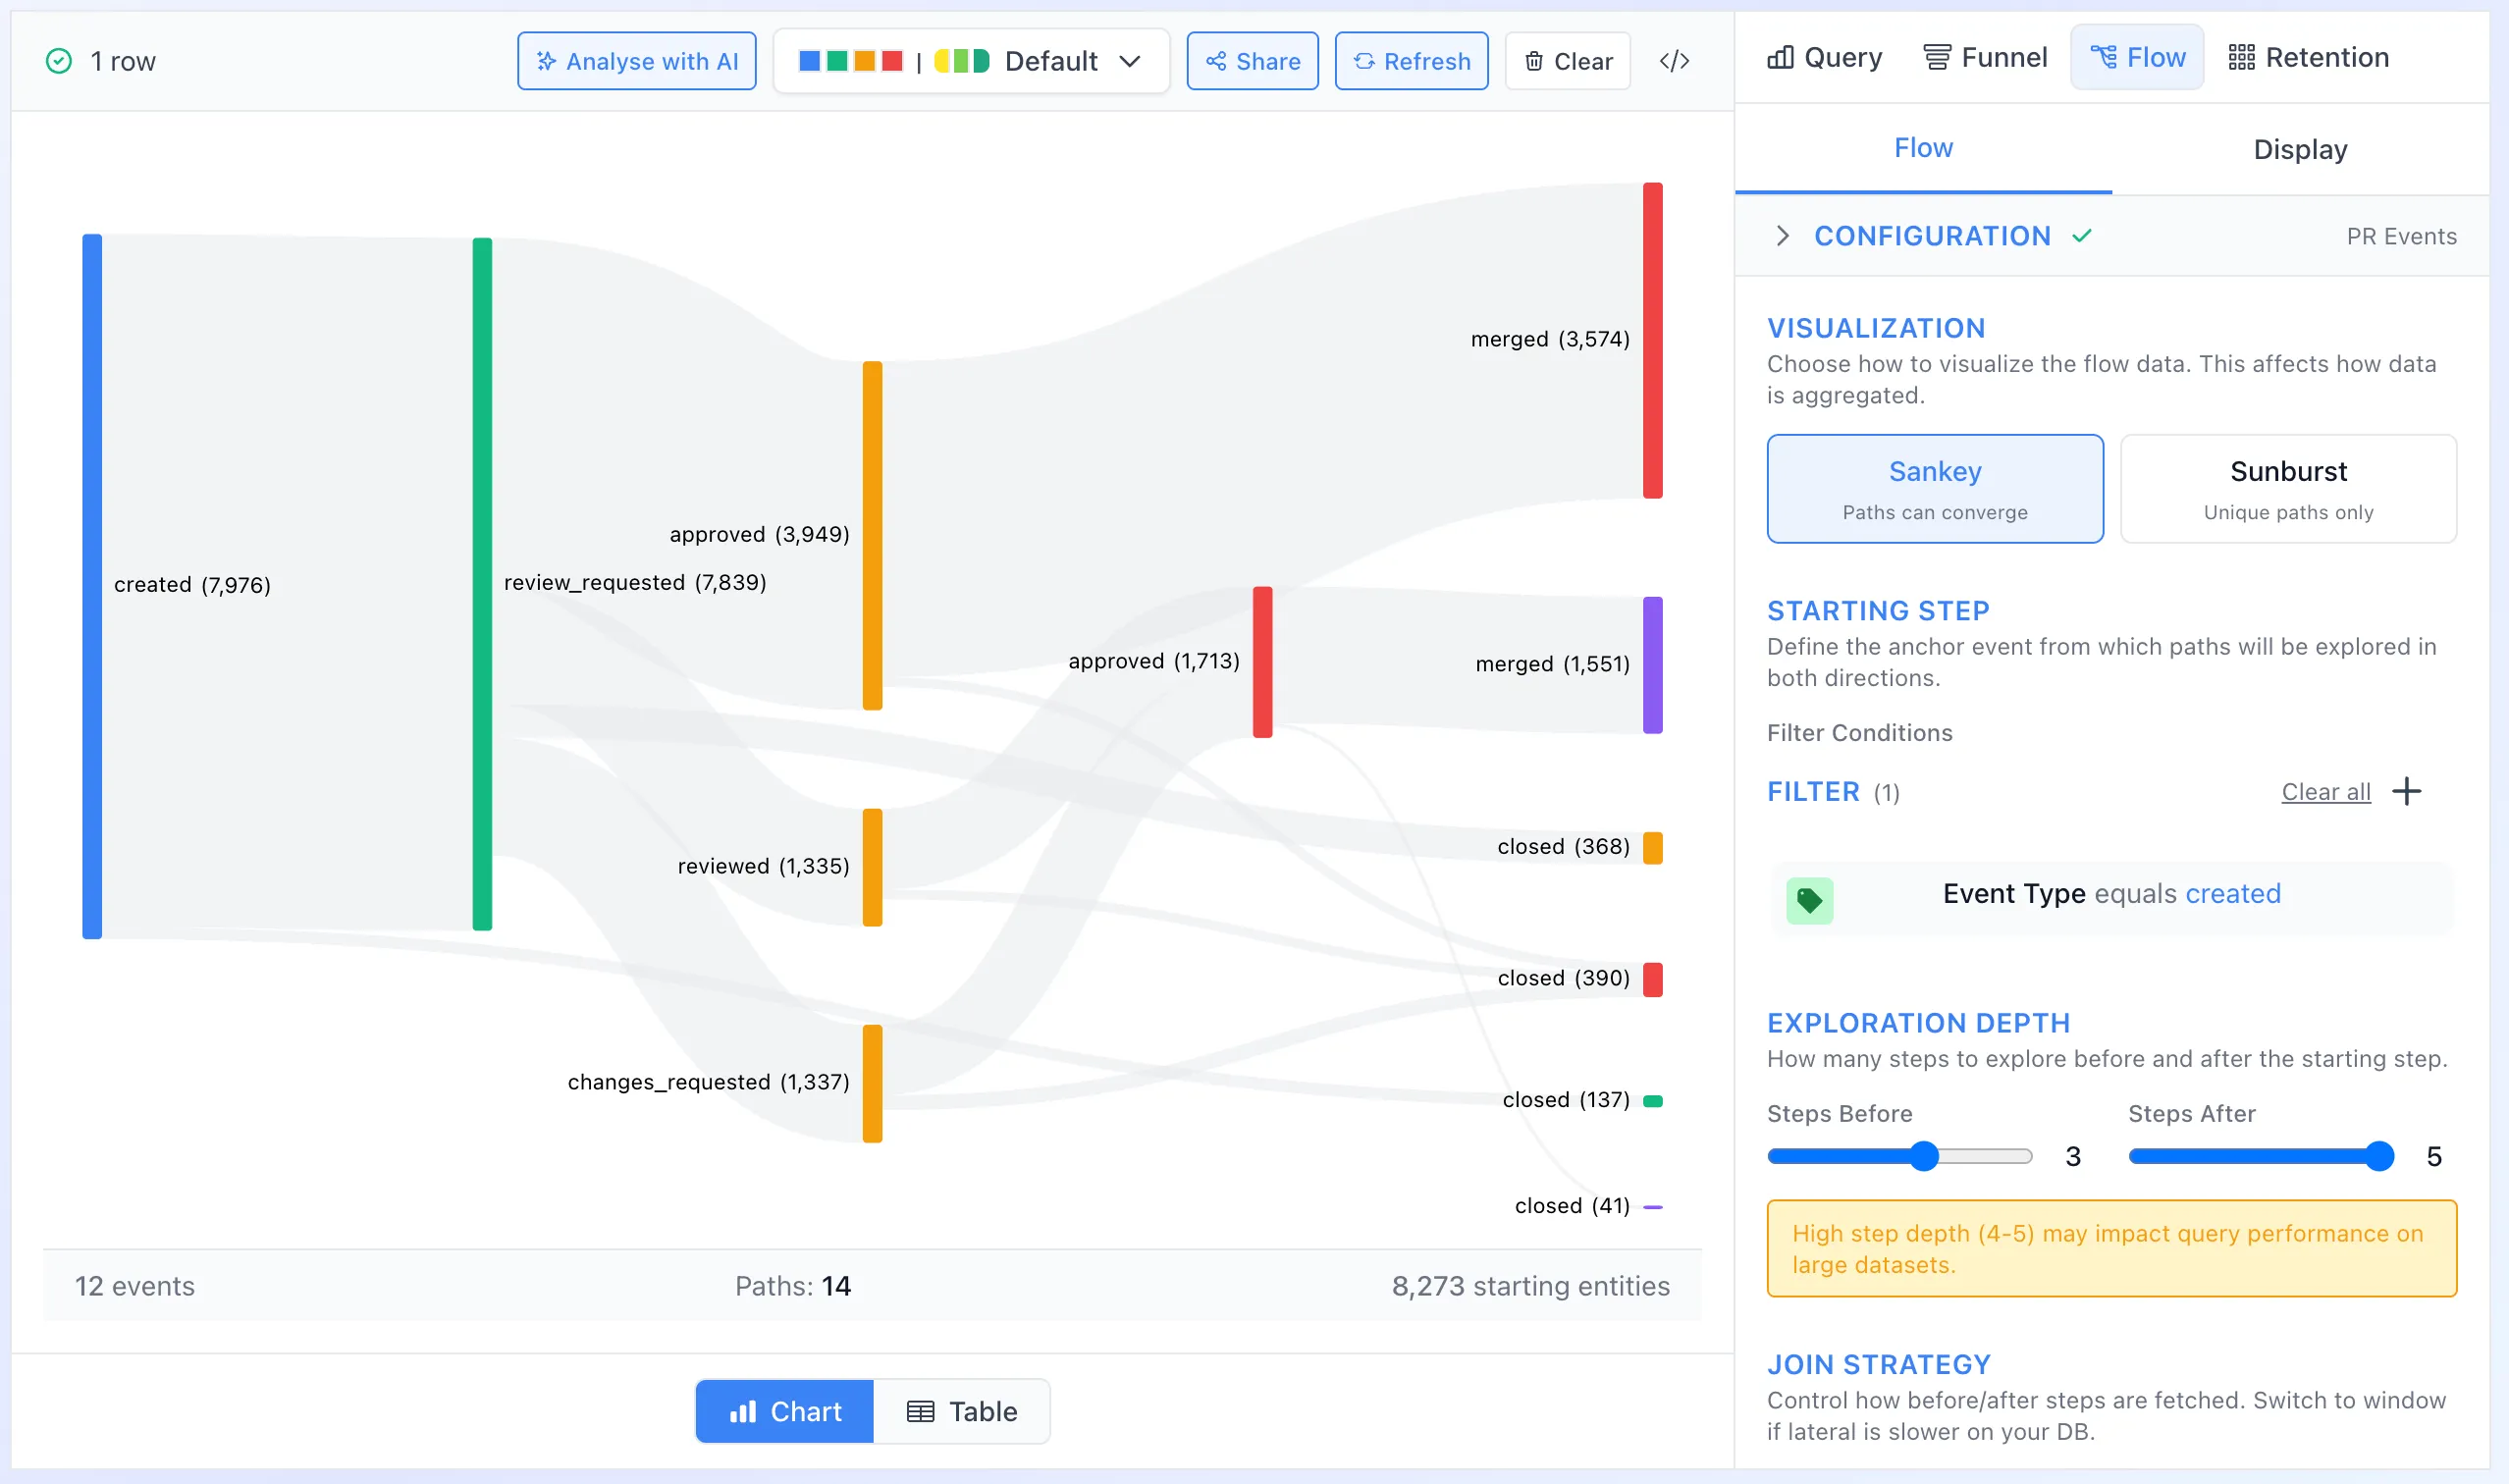
Analysis Builder
Interactive query builder with auto-execute, AI generation, and shareable URLs
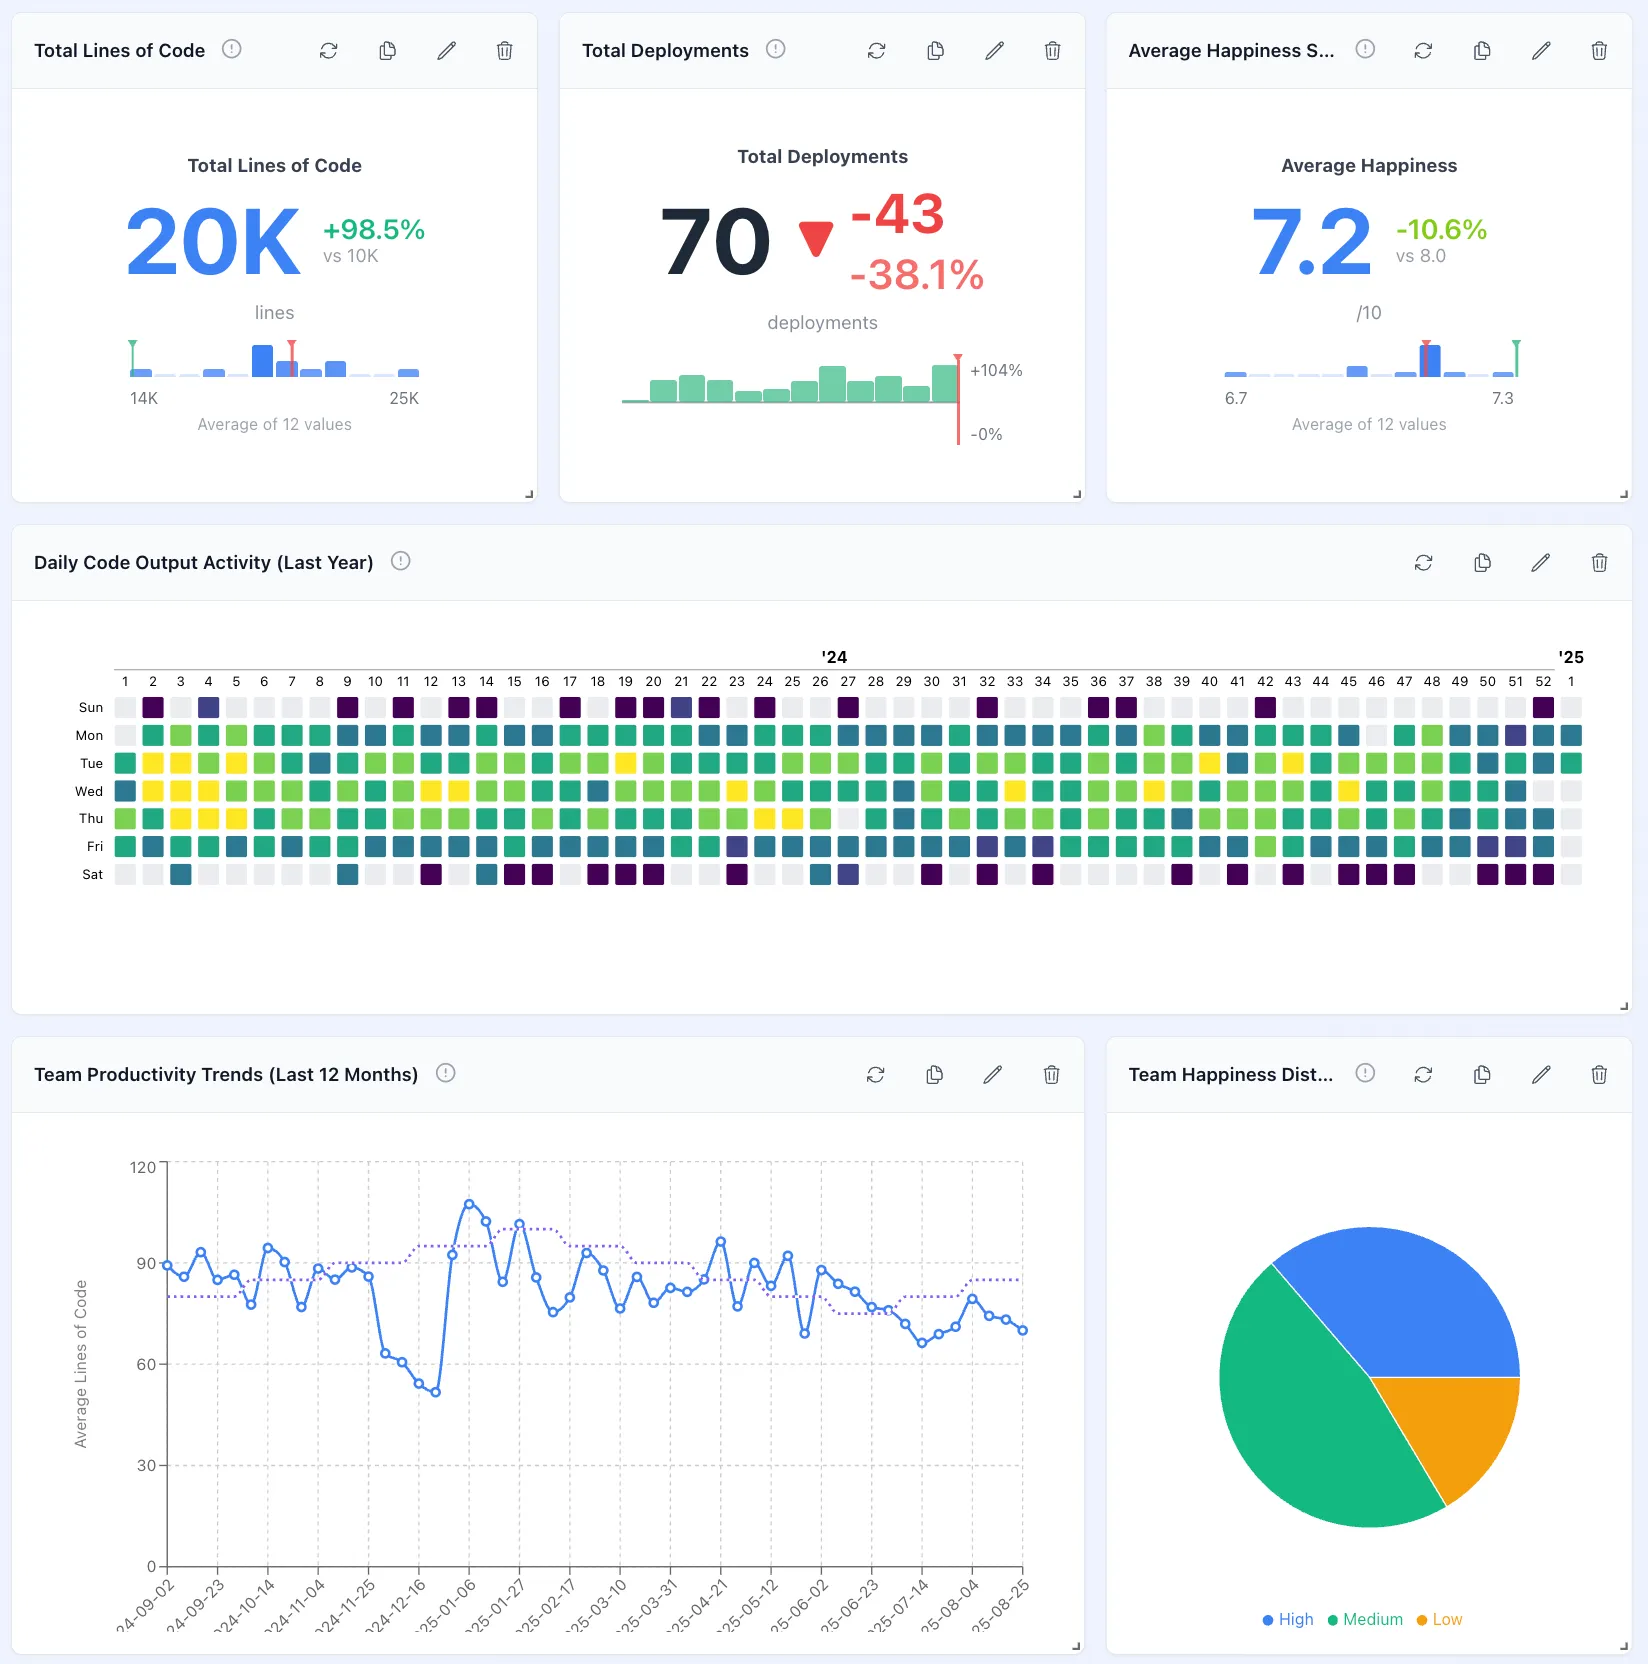
Dashboards
Drag-and-drop layouts with configurable portlets and persistence
The Drizzle Cube React client provides pre-built components and hooks for creating analytics dashboards and data visualizations with minimal code.
Installation
Section titled “Installation”npm install drizzle-cube react react-dom recharts react-grid-layout react-isDependencies & Requirements
Section titled “Dependencies & Requirements”Required Dependencies:
react(^18.0.0) - React frameworkreact-dom(^18.0.0) - React DOM renderingrecharts(^3.5.1) - Chart visualization libraryreact-grid-layout(^2.1.1) - Dashboard grid layoutreact-is(^19.2.3) - React type checking utilities
Optional Dependencies:
@heroicons/react(^2.2.0) - Icons used in components@tanstack/react-query(^5.0.0) - Data fetching and cachingreact-router-dom(^6.8.0) - Routing for multi-page dashboardsreactflow(^11.11.4) - Schema diagram visualizationdagre(^0.8.5) - Graph layout for schema diagramsd3(^7.9.0) - Data visualization utilities
Tailwind CSS v4 Required: Components are styled with Tailwind CSS v4 classes. You must have Tailwind CSS v4 configured in your project:
npm install -D tailwindcss @tailwindcss/postcss postcssConfigure your postcss.config.js:
export default { plugins: { '@tailwindcss/postcss': {}, },}Create a CSS file that imports Tailwind and the drizzle-cube styles:
@import "tailwindcss";@import "drizzle-cube/client/styles.css";Drizzle Cube uses prefixed Tailwind classes for full CSS isolation, so you don’t need to configure Tailwind to scan drizzle-cube’s source files.
Modular Imports
Section titled “Modular Imports”The drizzle-cube client is built with modular architecture allowing you to import only what you need:
| Import Path | Size | Contents | Use Case |
|---|---|---|---|
drizzle-cube/client | Full bundle | All components, hooks, charts | Complete dashboard apps |
drizzle-cube/client/charts | ~550 bytes + chunks | Chart components only | Custom UI with charts |
drizzle-cube/client/hooks | ~3.2KB | React hooks only | Headless data fetching |
drizzle-cube/client/providers | ~190 bytes + chunks | Context providers only | Custom implementations |
drizzle-cube/client/components | ~218KB | UI components (no charts) | Dashboard without charts |
drizzle-cube/client/utils | ~40 bytes | Utility functions only | Helper functions |
Chart-Only Import
Section titled “Chart-Only Import”Perfect for apps that need charts but want to build custom dashboards:
import { RechartsBarChart, RechartsLineChart, RechartsAreaChart } from 'drizzle-cube/client/charts';import { useCubeQuery } from 'drizzle-cube/client/hooks';import { CubeProvider } from 'drizzle-cube/client/providers';
function CustomDashboard() {  return (    <CubeProvider apiOptions={{ apiUrl: '/api/cube' }}>      <div className="grid grid-cols-2 gap-4">        <RechartsBarChart          data={data}          chartConfig={{ x: 'category', y: ['revenue'] }}        />        <RechartsLineChart          data={timeData}          chartConfig={{ x: 'date', y: ['sales'] }}        />      </div>    </CubeProvider>  );}
Hooks-Only Import
Section titled “Hooks-Only Import”For completely custom UI implementations:
import { useCubeQuery, useCubeMetaQuery } from 'drizzle-cube/client/hooks';
function CustomAnalytics() {  const { data, isLoading } = useCubeQuery({    measures: ['Sales.revenue'],    dimensions: ['Sales.category']  });  const { meta } = useCubeMetaQuery();
  // Build your own UI with the data  return (    <div>      <div>Available cubes: {meta?.cubes?.length ?? 0}</div>      {data?.map(row => (        <div key={row.category}>          {row.category}: ${row.revenue}        </div>      ))}    </div>  );}
Dependency Optimization
Section titled “Dependency Optimization”When using modular imports, you only need the dependencies for what you import:
# Full client - requires all dependenciesnpm install drizzle-cube react react-dom recharts react-grid-layout react-is
# Charts only - no grid layout needednpm install drizzle-cube react react-dom recharts
# Hooks only - minimal dependenciesnpm install drizzle-cube react react-dom
# Providers only - core functionalitynpm install drizzle-cube react react-dom
Usage Options
Section titled “Usage Options”Option 1: Full Import (All Features)
import { AnalyticsDashboard, CubeProvider } from 'drizzle-cube/client';Option 2: Modular Imports (Optimized Bundle Size) Import only what you need for smaller bundle sizes:
// Charts only (~550 bytes + shared chunks)import { RechartsBarChart, RechartsLineChart } from 'drizzle-cube/client/charts';
// Hooks only (~3.2KB)import { useCubeQuery, useCubeMetaQuery } from 'drizzle-cube/client/hooks';
// Providers only (~190 bytes + shared chunks)import { CubeProvider, createCubeClient } from 'drizzle-cube/client/providers';
// UI Components without charts (~218KB)import { AnalyticsDashboard } from 'drizzle-cube/client/components';import { AnalysisBuilder } from 'drizzle-cube/client';
// Utilities only (~40 bytes)import { formatChartData, validateCubeQuery } from 'drizzle-cube/client/utils';
Option 3: Copy-Paste for Customization
For more control over styling and behavior, you can copy component code from the complete example at /examples/hono/client in the repository or view the live version at try.drizzle-cube.dev.
Quick Start
Section titled “Quick Start”import React from 'react';import { CubeProvider, AnalyticsDashboard } from 'drizzle-cube/client';
function App() { return ( <CubeProvider apiOptions={{ apiUrl: '/api/cube', headers: { 'Authorization': 'your-token', // Token is used as-is, no 'Bearer' prefix needed 'X-Organisation-ID': '1' } }} > <AnalyticsDashboard initialLayout={[ { id: 'revenue-chart', title: 'Monthly Revenue', chartType: 'line', query: { measures: ['Sales.totalRevenue'], timeDimensions: [{ dimension: 'Sales.orderDate', granularity: 'month' }] } } ]} /> </CubeProvider> );}Core Components
Section titled “Core Components”CubeProvider
Section titled “CubeProvider”The foundation component that provides cube API context:
import { CubeProvider } from 'drizzle-cube/client';
function App() {  return (    <CubeProvider      apiOptions={{        apiUrl: '/api/cube',        headers: {          'Authorization': 'your-jwt-token', // Token is used as-is, no 'Bearer' prefix needed          'X-Organisation-ID': '123'        }      }}    >      {/* Your dashboard components */}    </CubeProvider>  );}
Credentials Configuration
Section titled “Credentials Configuration”By default, the client includes cookies with all requests (credentials: 'include'). This is useful for cookie-based session authentication. However, if you’re using token-based authentication (JWT, API keys, etc.), you can disable this:
// Token-based auth without cookies<CubeProvider  apiOptions={{    apiUrl: '/api/cube',    credentials: 'omit',  // Don't send cookies    headers: {      'Authorization': 'Bearer your-jwt-token'    }  }}>  {/* Your dashboard components */}</CubeProvider>
// Same-origin cookies only<CubeProvider  apiOptions={{    apiUrl: '/api/cube',    credentials: 'same-origin'  // Only send cookies to same origin  }}>  {/* Your dashboard components */}</CubeProvider>
// Default behavior (cookies always included)<CubeProvider  apiOptions={{    apiUrl: '/api/cube',    credentials: 'include'  // Default - include cookies for cross-origin requests  }}>  {/* Your dashboard components */}</CubeProvider>
Credentials Options:
'include'(default) - Always send cookies, even for cross-origin requests'same-origin'- Only send cookies if the request URL is on the same origin'omit'- Never send cookies
Features Configuration
Section titled “Features Configuration”Configure optional features through the features prop on CubeProvider:
<CubeProvider apiOptions={{ apiUrl: '/api/cube' }} features={{ enableAI: true, // Enable AI query generation (default: true) aiEndpoint: '/api/ai/generate', // Custom AI endpoint useAnalysisBuilder: true, // Use new AnalysisBuilder modal for portlet editing editToolbar: 'both', // Edit toolbar display mode floatingToolbarPosition: 'right' // Position of floating toolbar }}> {/* Your components */}</CubeProvider>Feature Options
Section titled “Feature Options”| Feature | Type | Default | Description |
|---|---|---|---|
enableAI | boolean | true | Enable AI-powered query generation |
aiEndpoint | string | '/api/ai/generate' | Custom endpoint for AI query generation |
showSchemaDiagram | boolean | false | Show interactive schema visualization button in AnalysisBuilder results panel (requires @xyflow/react and elkjs) |
useAnalysisBuilder | boolean | false | Use new AnalysisBuilder modal for portlet editing |
editToolbar | 'floating' | 'top' | 'both' | 'both' | Which edit toolbar(s) to display |
floatingToolbarPosition | 'left' | 'right' | 'right' | Position of floating toolbar |
Edit Toolbar Modes
Section titled “Edit Toolbar Modes”The editToolbar option controls which editing toolbar(s) are displayed on dashboards:
-
'both'(default): Shows both the top edit bar and a floating toolbar. The floating toolbar appears when you scroll past the top bar, providing persistent access to edit controls. -
'floating': Shows only the floating toolbar (no top bar). The floating toolbar is always visible on the side of the screen, providing a compact editing interface. -
'top': Shows only the top edit bar (no floating toolbar). The traditional editing interface at the top of the dashboard.
// Floating toolbar only - compact sidebar editing<CubeProvider  apiOptions={{ apiUrl: '/api/cube' }}  features={{    editToolbar: 'floating',    floatingToolbarPosition: 'left'  // Position on left side  }}>  <AnalyticsDashboard config={config} editable={true} /></CubeProvider>
// Top bar only - traditional editing interface<CubeProvider  features={{ editToolbar: 'top' }}>  <AnalyticsDashboard config={config} editable={true} /></CubeProvider>
// Both toolbars - floating appears on scroll (default)<CubeProvider  features={{ editToolbar: 'both' }}>  <AnalyticsDashboard config={config} editable={true} /></CubeProvider>
The floating toolbar provides quick access to:
- Toggle edit mode (with save icon when editing)
- Switch between Grid and Rows layout modes
- Color palette selection
- Add new portlet
AnalyticsDashboard
Section titled “AnalyticsDashboard”A complete dashboard with drag-and-drop layout:
import { AnalyticsDashboard } from 'drizzle-cube/client';
<AnalyticsDashboard  initialLayout={[    {      id: 'sales-overview',      title: 'Sales Overview',      chartType: 'bar',      query: {        measures: ['Sales.totalRevenue', 'Sales.orderCount'],        dimensions: ['Sales.productCategory']      },      layout: { x: 0, y: 0, w: 6, h: 4 }    },    {      id: 'sales-trend',      title: 'Sales Trend',      chartType: 'line',      query: {        measures: ['Sales.totalRevenue'],        timeDimensions: [{          dimension: 'Sales.orderDate',          granularity: 'day'        }]      },      layout: { x: 6, y: 0, w: 6, h: 4 }    }  ]}
  onLayoutChange={(layout) => {    // Save layout to user preferences    localStorage.setItem('dashboard-layout', JSON.stringify(layout));  }}
  showEditControls={true}  allowResize={true}  allowDrag={true}/>
AnalyticsPage
Section titled “AnalyticsPage”A complete page with sidebar filters and charts:
import { AnalyticsPage } from 'drizzle-cube/client';
<AnalyticsPage  title="Sales Analytics"  description="Comprehensive sales performance metrics"
  filters={[    {      member: 'Sales.productCategory',      title: 'Product Category',      type: 'select'    },    {      member: 'Sales.orderDate',      title: 'Date Range',      type: 'dateRange'    }  ]}
  charts={[    {      id: 'revenue-by-category',      title: 'Revenue by Category',      chartType: 'pie',      query: {        measures: ['Sales.totalRevenue'],        dimensions: ['Sales.productCategory']      }    }  ]}/>
AnalyticsPortlet
Section titled “AnalyticsPortlet”Individual chart components:
import { AnalyticsPortlet } from 'drizzle-cube/client';
<AnalyticsPortlet  title="Monthly Sales Trend"  chartType="line"  query={{    measures: ['Sales.totalRevenue'],    timeDimensions: [{      dimension: 'Sales.orderDate',      granularity: 'month'    }]  }}
  showControls={true}  allowExport={true}  refreshInterval={30000} // Refresh every 30 seconds
  onDataLoad={(data) => {    console.log('Chart data loaded:', data);  }}/>
AnalysisBuilder
Section titled “AnalysisBuilder”Interactive query builder:
import { AnalysisBuilder } from 'drizzle-cube/client';
<AnalysisBuilder  initialQuery={{    measures: ['Sales.totalRevenue'],    dimensions: ['Sales.productCategory']  }}
  // Optional: disable localStorage persistence  disableLocalStorage={false}
// Optional: hide settings panel hideSettings={false}/>Note: AnalysisBuilder now uses the CubeProvider context for API configuration. The settings panel allows dynamic URL/token changes.
AnalysisBuilder Features:
- Interactive Cube Explorer: Browse available cubes, measures, and dimensions
- Drag & Drop Query Building: Visual query construction interface
- API Configuration Panel: Configure endpoint URL and authentication
- Real-time Query Execution: Execute queries and view results instantly
- SQL Preview: View generated SQL for debugging
- Dry Run Mode: Validate queries without execution
Chart Types
Section titled “Chart Types”Line Charts
Section titled “Line Charts”Perfect for time series data:
<AnalyticsPortlet chartType="line" query={{ measures: ['Sales.totalRevenue'], timeDimensions: [{ dimension: 'Sales.orderDate', granularity: 'day' }] }}/>Bar Charts
Section titled “Bar Charts”Great for comparing categories:
<AnalyticsPortlet chartType="bar" query={{ measures: ['Sales.totalRevenue', 'Sales.orderCount'], dimensions: ['Sales.productCategory'] }}/>Pie Charts
Section titled “Pie Charts”Show proportions:
<AnalyticsPortlet chartType="pie" query={{ measures: ['Sales.totalRevenue'], dimensions: ['Sales.region'] }}/>Data Tables
Section titled “Data Tables”Detailed data views:
<AnalyticsPortlet  chartType="table"  query={{    measures: ['Sales.totalRevenue', 'Sales.orderCount'],    dimensions: ['Sales.customerName', 'Sales.productCategory']  }}
pageSize={20} sortable={true} searchable={true}/>useCubeQuery
Section titled “useCubeQuery”Execute queries and get real-time data:
import { useCubeQuery } from 'drizzle-cube/client';
function SalesMetric() {  const { data, isLoading, error, resultSet } = useCubeQuery({    measures: ['Sales.totalRevenue'],    dimensions: ['Sales.productCategory'],    filters: [{      member: 'Sales.orderDate',      operator: 'inDateRange',      values: ['2024-01-01', '2024-12-31']    }]  });
  if (isLoading) return <div>Loading...</div>;  if (error) return <div>Error: {error.message}</div>;
  // The client automatically handles both old and new response formats  // data contains the raw data array from results[0].data or legacy data field  // resultSet provides access to the full Cube.js response structure
  return (    <div>      <h2>Total Revenue: ${data[0]?.['Sales.totalRevenue'] || 0}</h2>      {/* Access annotation metadata */}      <p>Query executed at: {resultSet?.annotation?.lastRefreshTime}</p>      {/* Render your data */}    </div>  );}
useCubeMeta
Section titled “useCubeMeta”Access cube metadata:
import { useCubeMeta } from 'drizzle-cube/client';
function MetricSelector() {  const { cubes, isLoading } = useCubeMeta();
  if (isLoading) return <div>Loading cubes...</div>;
  return (    <select>      {cubes.map(cube =>        cube.measures.map(measure => (          <option key={`${cube.name}.${measure.name}`}                  value={`${cube.name}.${measure.name}`}>            {measure.title || measure.name}          </option>        ))      )}    </select>  );}
Customization
Section titled “Customization”Custom Chart Components
Section titled “Custom Chart Components”Create your own visualizations:
import { useCubeQuery } from 'drizzle-cube/client';import { ResponsiveContainer, ComposedChart, Bar, Line, XAxis, YAxis } from 'recharts';
function CustomChart({ query }) {  const { data, isLoading } = useCubeQuery(query);
  if (isLoading) return <div>Loading...</div>;
  return (    <ResponsiveContainer width="100%" height={300}>      <ComposedChart data={data}>        <XAxis dataKey="Sales.orderDate" />        <YAxis />        <Bar dataKey="Sales.orderCount" fill="#8884d8" />        <Line dataKey="Sales.totalRevenue" stroke="#82ca9d" />      </ComposedChart>    </ResponsiveContainer>  );}
Theme Customization
Section titled “Theme Customization”Customize the appearance:
import { CubeProvider } from 'drizzle-cube/client';
const theme = {  colors: {    primary: '#3b82f6',    secondary: '#64748b',    success: '#10b981',    warning: '#f59e0b',    error: '#ef4444'  },  fonts: {    body: 'Inter, sans-serif',    mono: 'Fira Code, monospace'  }};
<CubeProvider  apiOptions={{ apiUrl: '/api/cube' }}  theme={theme}>  {/* Your components */}</CubeProvider>
Real-time Updates
Section titled “Real-time Updates”WebSocket Support
Section titled “WebSocket Support”Enable real-time data updates:
<CubeProvider apiOptions={{ apiUrl: '/api/cube', websocketUrl: 'ws://localhost:3000/ws', headers: { 'Authorization': 'token' // Token is used as-is, no 'Bearer' prefix needed } }}> <AnalyticsPortlet query={query} realtime={true} refreshInterval={5000} /></CubeProvider>Manual Refresh
Section titled “Manual Refresh”Trigger updates programmatically:
import { useCubeQuery } from 'drizzle-cube/client';
function RefreshableChart() {  const { data, isLoading, refetch } = useCubeQuery(query);
  return (    <div>      <button onClick={() => refetch()}>        Refresh Data      </button>      {/* Chart content */}    </div>  );}
Error Handling
Section titled “Error Handling”Error Boundaries
Section titled “Error Boundaries”Handle errors gracefully:
import { ChartErrorBoundary } from 'drizzle-cube/client';
<ChartErrorBoundary  fallback={({ error, resetError }) => (    <div className="error-state">      <h3>Something went wrong</h3>      <p>{error.message}</p>      <button onClick={resetError}>Try again</button>    </div>  )}>  <AnalyticsPortlet query={query} /></ChartErrorBoundary>
Query Validation
Section titled “Query Validation”Validate queries before execution:
import { validateCubeQuery } from 'drizzle-cube/client';
function AnalysisBuilder({ query, onChange }) {  const validation = validateCubeQuery(query);
  if (!validation.isValid) {    return (      <div className="validation-errors">        {validation.errors.map(error => (          <div key={error.field}>{error.message}</div>        ))}      </div>    );  }
  return <AnalyticsPortlet query={query} />;}
Performance Tips
Section titled “Performance Tips”Query Optimization
Section titled “Query Optimization”- Use appropriate granularities for time dimensions
- Limit result sets with filters
- Cache frequently used queries
Component Optimization
Section titled “Component Optimization”- Memoize expensive calculations
- Use React.memo for pure components
- Implement virtualization for large datasets
Bundle Optimization
Section titled “Bundle Optimization”- Tree shake unused chart types
- Code split dashboard components
- Lazy load visualization libraries
Next Steps
Section titled “Next Steps”- Analysis Builder - Interactive query builder
- Dashboards - Dashboard customization
- Charts - Detailed chart documentation
- Hooks - Advanced hook usage